No Results Found
Try using different keywords or check your spelling
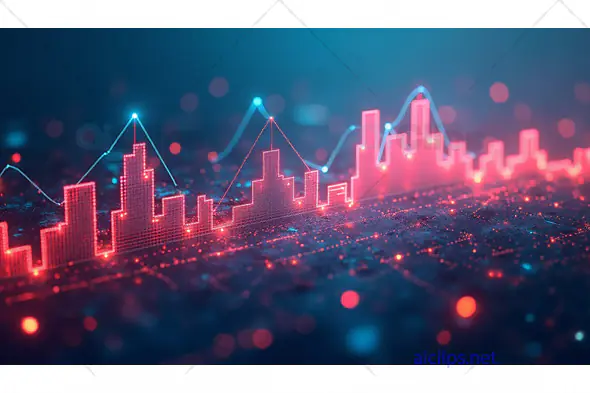
Digital Cityscape with Rising Data Graph – Financial and Market Analytics Visualization
By Jayesh
Item Details
This futuristic image features a digital representation of a city skyline integrated with glowing red and blue data graph lines. The illuminated points and the vibrant data lines running across the cityscape symbolize market growth, financial trends, and the rise of urban economies. The glowing effect and tech-driven aesthetics make this visual a perfect representation of data analytics, fintech, or smart city technologies.
Ideal for financial presentations, market analysis reports, fintech marketing, or tech-driven blog posts, this image communicates the concepts of growth, innovation, and data-driven decision-making. The blend of urban infrastructure with a glowing digital graph conveys a sense of forward momentum, making it suitable for use in content focusing on future trends, smart cities, economic growth, or stock market performance.
Available on AIClips.net, this high-quality image can be seamlessly integrated into design software like Photoshop, Premiere Pro, and After Effects, offering a visually engaging asset for any project related to financial growth, business analytics, or urban development.
ITEM TAGS


_prv.webp)
_prv.webp)


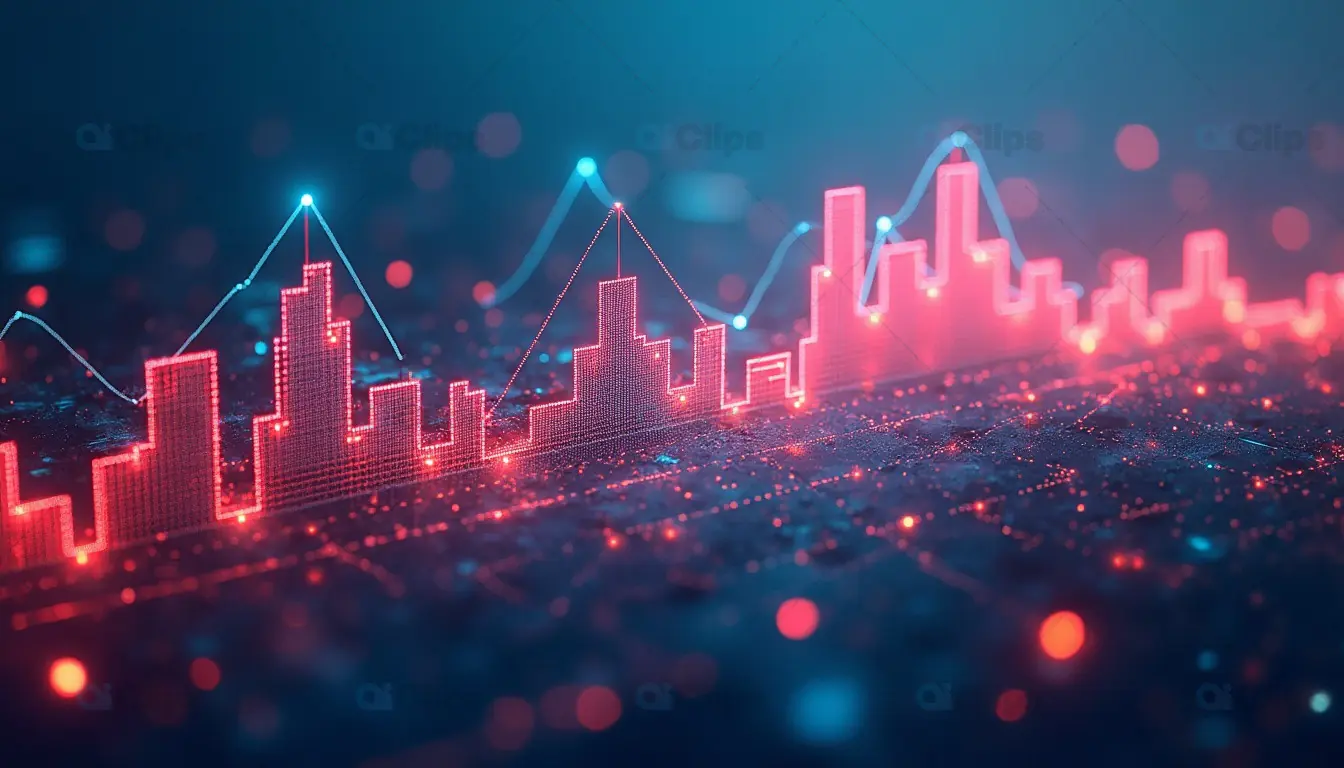
Digital Cityscape with Rising Data Graph – Financial and Market Analytics Visualization
By Jayesh
This futuristic image features a digital representation of a city skyline integrated with glowing red and blue data graph lines. The illuminated points and the vibrant data lines running across the cityscape symbolize market growth, financial trends, and the rise of urban economies. The glowing effect and tech-driven aesthetics make this visual a perfect representation of data analytics, fintech, or smart city technologies.
Ideal for financial presentations, market analysis reports, fintech marketing, or tech-driven blog posts, this image communicates the concepts of growth, innovation, and data-driven decision-making. The blend of urban infrastructure with a glowing digital graph conveys a sense of forward momentum, making it suitable for use in content focusing on future trends, smart cities, economic growth, or stock market performance.
Available on AIClips.net, this high-quality image can be seamlessly integrated into design software like Photoshop, Premiere Pro, and After Effects, offering a visually engaging asset for any project related to financial growth, business analytics, or urban development.