No Results Found
Try using different keywords or check your spelling
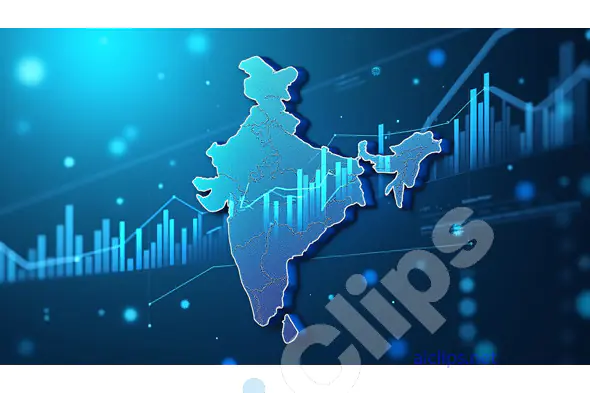
India Economic Growth Map with Financial Charts
By Vijaykumar
This visually engaging image showcases a stylized map of India, intricately overlaid with financial charts and growth indicators. Rendered in cool blue tones, the image symbolizes economic progress, data analysis, and market trends within the Indian context. The map is detailed with state boundaries and is accompanied by rising bar charts and line graphs, representing financial growth and the dynamic nature of India's economy.
This image is ideal for use in financial reports, business presentations, economic analysis, and marketing materials that focus on India's market potential and economic development. The modern and professional design of the image makes it suitable for illustrating complex data in a clear and visually appealing manner, helping audiences easily understand and engage with the information presented.
Available on AIClips.net, this image can be seamlessly integrated into design software like Adobe Photoshop, Illustrator, and more. It’s a powerful tool for financial analysts, business strategists, marketers, and educators who want to convey economic insights with precision and impact.
ITEM TAGS


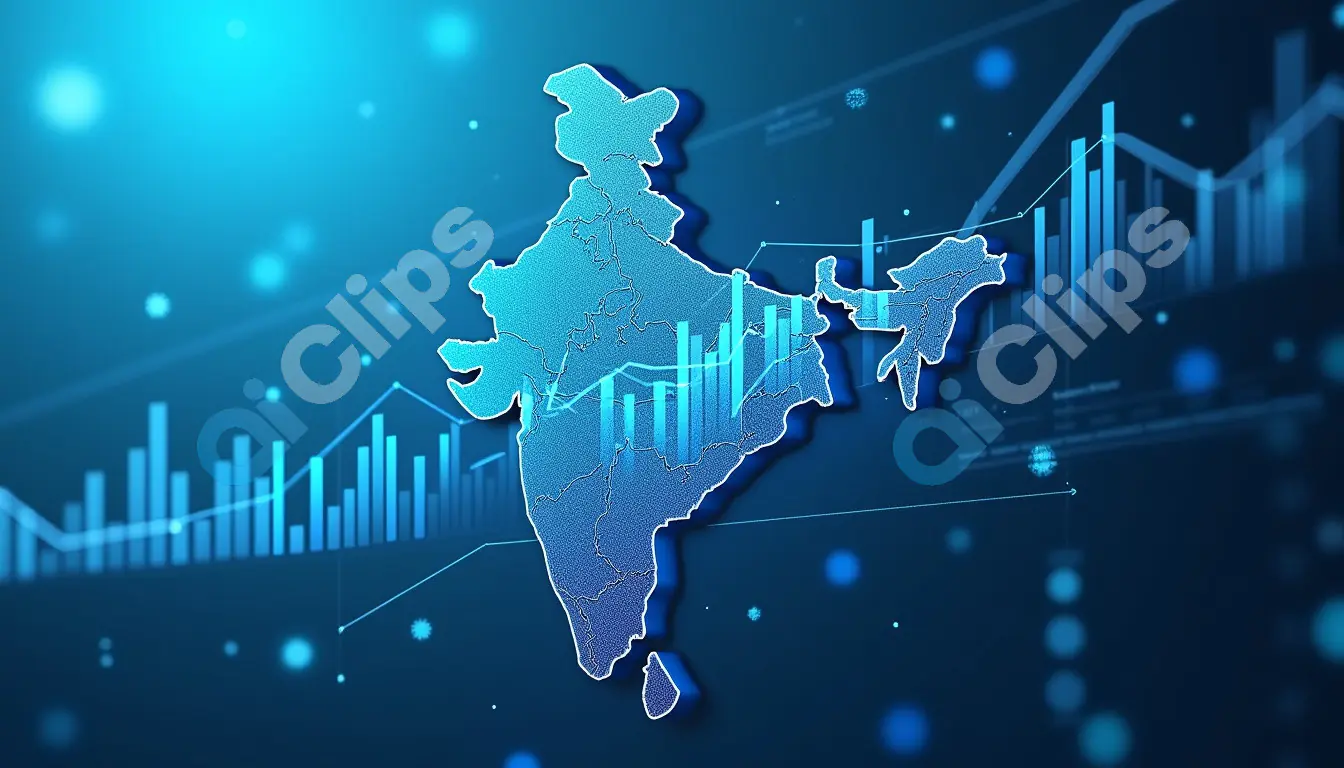
India Economic Growth Map with Financial Charts
By Vijaykumar
This visually engaging image showcases a stylized map of India, intricately overlaid with financial charts and growth indicators. Rendered in cool blue tones, the image symbolizes economic progress, data analysis, and market trends within the Indian context. The map is detailed with state boundaries and is accompanied by rising bar charts and line graphs, representing financial growth and the dynamic nature of India's economy.
This image is ideal for use in financial reports, business presentations, economic analysis, and marketing materials that focus on India's market potential and economic development. The modern and professional design of the image makes it suitable for illustrating complex data in a clear and visually appealing manner, helping audiences easily understand and engage with the information presented.
Available on AIClips.net, this image can be seamlessly integrated into design software like Adobe Photoshop, Illustrator, and more. It’s a powerful tool for financial analysts, business strategists, marketers, and educators who want to convey economic insights with precision and impact.